China Nuclear Data Center(CNDC)
Graph Digitizing System(GDGraph)

Introduction of the Digitization Software GDGraph
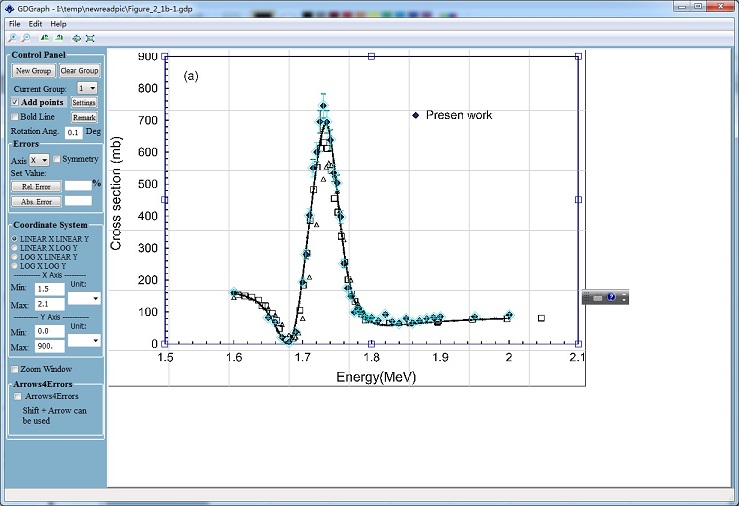
The evaluators and experimenters always desire to have full and latest experimental data sets. However, the data are often published on figures without numerical values for some publications or journals. Furthermore, the quality of figures is not always good enough, especially for some figures scanned from the hardcopy of old publications. Furthermore the researchers would like to retrieve the data directly from EXFOR database. So digitization of figures is only one method to obtain the data and correlative uncertainty from old publications. For the requirements from evaluation, measurement and EXFOR compilation, we need to develop software fordigitization at China Nuclear Data Center (CNDC).
System Requirement
windows xp,windows 2000,windows 7,windows 8 ,windows 10
note:
*Please use this system at your own risk.
* It's not allowed to use this system for any kind of bussiness purpose.
All rights reserved by Jin Yongli. China Nuclear Data Center.
GDGraph's History:
Before 2000, there was no common software to digitize experimental and evaluated data. And the quality of digitization results couldn't fit the requirements of evaluation and measurement using the traditional coordinate paper or rule. The end of twenty century, the personal computer is developing so quickly that to develop software for digitization purpose become possible. Since 1997, China Nuclear Data Center devotes to develop software for digitization. 4 years later, the first version of digitization software GDgraph was released and developed using VC++ computer language. Although, the functions of the 1st version of GDgraph is fit the basic requirements of digitization only, in which can digitize one group data excluding data uncertainty, BMP image format only, and it couldn't randomly delete digitizing points. However, the mold of GDgraph software can obtain higher quality digitizing results and efficiency than the traditional way.
After 5 years to use GDgraph, we collected much feedback information on update and some bugs on this software. The 2nd version of GDgraph software was released at 2006, in which the whole software was rewritten using Perl computer language to obtain more comfortable condition for programming and update requirements. Some new functions are listed as following:
1) The graphics can be opened including mostly image format such as jpg, png, bmp etc.
2) The graphics could be zoom-in and zoom-out.
3) Using new button to realize the graphics rotation, so the coordinate of image could fit well with the software one.
4) The image size could automatically fit to the GUI window.
5) Revert image size after the original one is been zoom-in or zoom-out by the digitizer.
6) Allow to add and delete data groups. The maximum number of data group is three and use blue, red and green colour to represent each data group, respectively.
7) Allow to randomly add and move the digitizing point by mouse.
8) Output data could be saved as a data file or clipboard.
9) Allow to digitize y error with mouse.
10) Allow to set fix value for y uncertainty using relative (%, in per cent) or absolute value.
The 3rd version of GDgraph software was released at 2011. Some new functions are list as following:
1) Allow to copy image directly from clipboard.
2) Allow to select thin or thick line for axis and error bar line of digitization.
3) Except for the rotation figure function, there are allow user to set rotated angle to realize slightly degree rotation.
4) Partially zoom-in of the selected point is available for checking the position of digitizing point.
5) The digitizing axis and image could zoom-in and zoom-out together.
6) Allow to move the digitizing point by keyboard for slightly adjusting the position.
The version of GDgraph is 4.4 and released at 2012. Some new features are list as following:
1) Allow to digitize x error and use keyboard to move xy error bars.
2) Add Project and Remarks function. The Project function allows to save image, digitizing results, coordinate setting and other setting together for next time to check and modify. The Remarks function allows to keep some marks and memo text for checking, modification and memory.
3) Add Setting function, so to change the colour, size and symbol of point is available. The size of partially zoom-in window is allowed to be changed. Allow to change the magnification of partially zoom-in from 200% to 400% for obtaining more clear point image. Allow to change the length of error bar cross line to fit the error bar in image. The grid and the setting of the space is available.
4) Allow to move partially zoom-in window by mouse.
Since 1997, the digitization software GDgraph is developed to fit the requirements of evaluation, measurement and EXFOR compilation also. From the mold software to present version 4.4, GDgraph is mainly fit the requirements, although there are some aspects need to modify and also add some new functions also.
Changelog for GDGraph 5.1:
new features:
1)Shortcut Key to activate original point of axes (Ctrl+X,switch key)
2)Allow to move the axis by cursor keys(After activating original point by 'Ctrl+X',switch key)
3)Zoom in Window for original points of axes (After activating original point by 'Ctrl+X',switch key)
4)Axis Color Menu: Choose color for axis
5)Loadimage &reset Menu : clear all previos data and load an image.
6)Tab key can be used for switching input focus on minx,maxx ,miny,maxy
7) Shortcut key for Arrow4Errors:Ctrl+alter
8)outputing format: two column sequence can be chosen,dy+,dy-,dx+,dx- or dy+,dy-,dx-,dx+;more data format can be used .
Fixed:
1) Pagedown key caused points array out of bouds (when one group is empty)
2)Lose rotation angle when resize or fit size the image
3) Incorrect calculation for scrollbar when resize the image.
Download the latest version
GDGraph 5.1(English Version)
Previous Version
GDGraph 5.0(English Version)
GDGraph 4.4 (Chinese Version)